File:2006cargo fleet.PNG

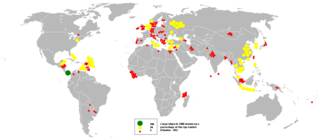
This bubble map shows the global distribution of Cargo ships in 2006 as a percentage of the top market (Panama - 992).
This map is consistent with incomplete set of data too as long as the top producer is known. It resolves the accessibility issues faced by colour-coded maps that may not be properly rendered in old computer screens.
Data was extracted on 30th September 2007 from https://www.cia.gov/library/publications/the-world-factbook/fields/2108.html
Based on Image:BlankMap-World.png
Licensing
I, the creator of this work, hereby release it into the public domain. This applies worldwide.
In case this is not legally possible,
I grant any entity the right to use this work for any purpose, without any conditions, unless such conditions are required by law.
File history
Click on a date/time to view the file as it appeared at that time.
| Date/Time | Thumbnail | Dimensions | User | Comment | |
|---|---|---|---|---|---|
| current | 03:34, 10 July 2010 | | 1,425 × 625 (62 KB) | Admin (talk | contribs) | This bubble map shows the global distribution of Cargo ships in 2006 as a percentage of the top market (Panama - 992). This map is consistent with incomplete set of data too as long as the top producer is known. It resolves the accessibility issues faced by colour-coded maps that may not be properly rendered in old computer screens. Data was extracted on 30th September 2007 from https://www.cia.gov/library/publications/the-world-factbook/fields/2108.html Based on Image:BlankMap-World.png == Licensing == {{PD-self|date=September 2007}} |
- You cannot overwrite this file.
File usage
The following page links to this file:
